
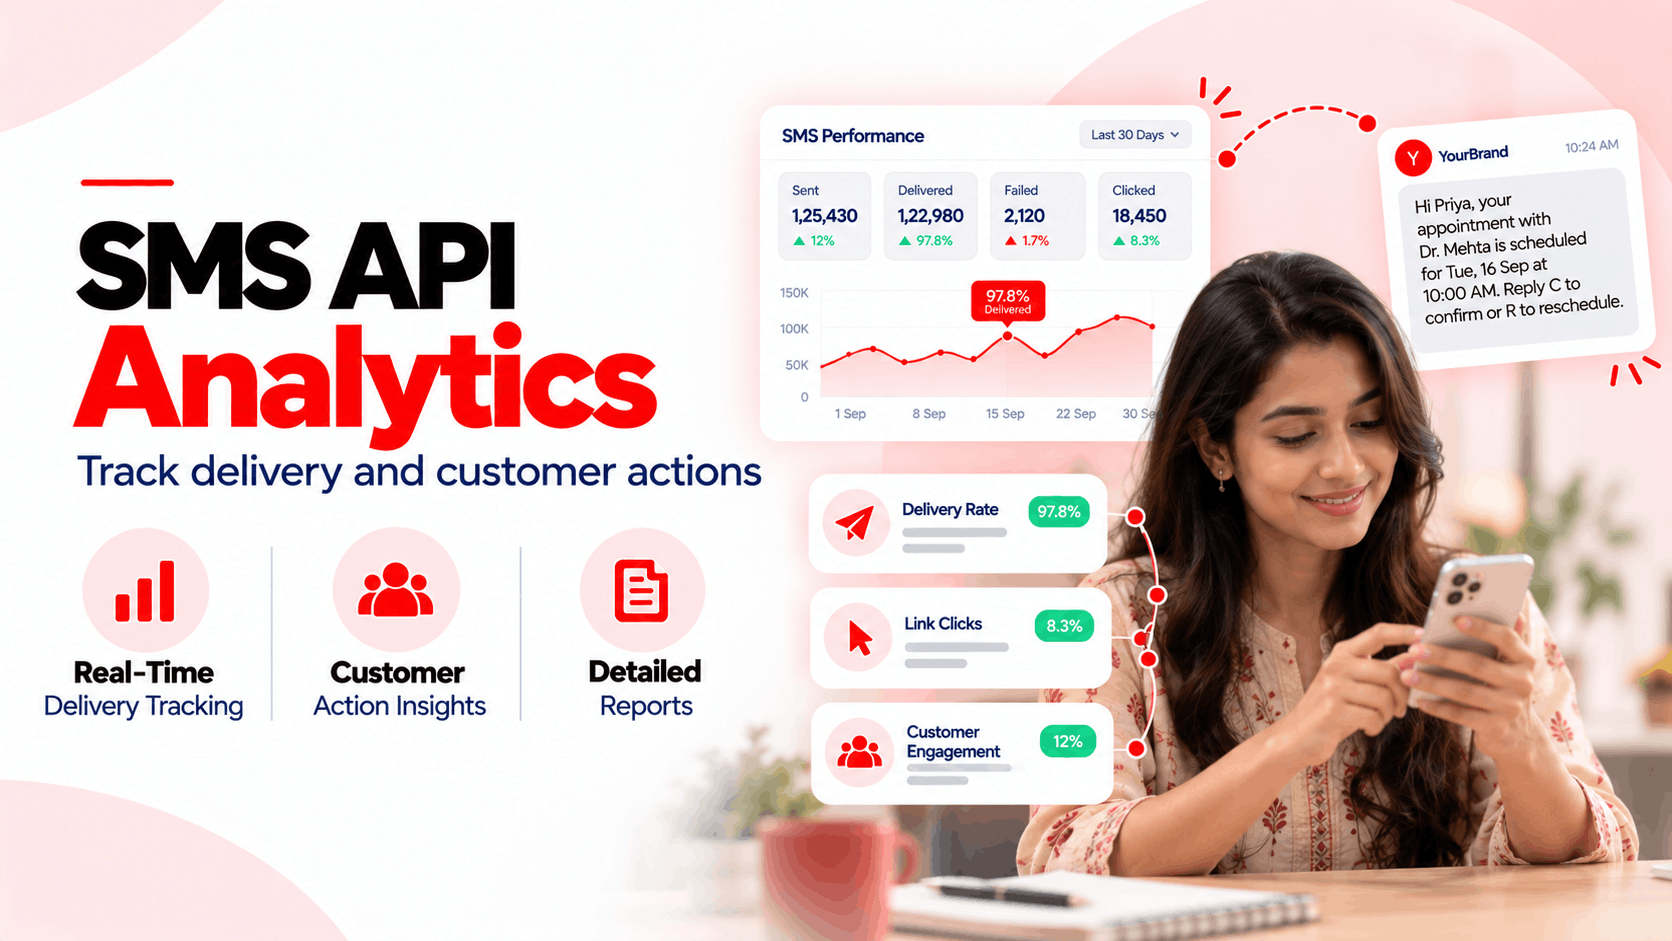


Most SMS dashboards look healthy right up until customers start complaining. Delivery sits in the high nineties, averages look fine, and nobody notices that one operator's OTPs take a minute to arrive. SMS API analytics should catch that before support does. This guide covers which metrics matter, what SMS can't measure, how to collect the data properly, and how to judge a provider's reporting.
What should SMS API analytics measure?
SMS API analytics should measure whether messages arrive, how fast, why they fail, and what recipients do next. The core set covers delivery rate, latency percentiles, failures by class, click-through, conversions, opt-outs, and cost per outcome. Each needs a fixed formula, a breakdown by operator and route, and a link to business events.
Metric | Formula | What it shows |
|---|---|---|
Delivery rate | Delivered receipts ÷ messages accepted by the provider | Route and list health |
Failure rate by class | Failures in a class ÷ messages accepted | Whether problems are permanent, temporary, or compliance-related |
Latency p50 / p95 | Time from submission to delivery receipt | Speed, especially for OTPs |
Click-through rate | Unique clicks ÷ delivered messages | Response to content and offers |
Conversion rate | Conversions ÷ delivered messages | Business outcome |
Opt-out rate | Opt-outs ÷ delivered messages | Fatigue and relevance |
Cost per outcome | Total spend ÷ conversions or verifications | True efficiency |
Define SMS delivery rate once, and stick to it
SMS delivery rate sounds simple, yet published definitions disagree. Some divide delivered messages by messages sent. Others divide by total recipients. Those numbers diverge whenever messages are rejected before sending or recipients get multiple messages.
We recommend dividing by messages accepted by the provider. Rejections before acceptance, such as invalid formatting or blocked templates, belong in a separate failure metric. Writing the formula into the dashboard itself prevents different teams from quoting different SMS delivery rate figures in the same meeting.
What SMS can't measure, and what to use instead
Standard application-to-person SMS has no read receipt. Once a message reaches the handset, no signal returns to the sender when the recipient opens it. Any "open rate" figure attached to plain SMS is therefore an estimate or a relabelled delivery rate.
Four signals can be measured reliably:
- Delivery, through delivery reports.
- Clicks, through tracked short links.
- Replies, through a reply-capable number.
- Conversions, by joining the message ID to an order, login, or payment.
When read confirmation genuinely matters, channels with native read receipts, such as WhatsApp and RCS, provide it. That's a reason to compare channels, not to invent SMS metrics.
Collecting the data
Good analytics start with complete, message-level data. Dashboards built on partial data look precise and mislead.
Webhooks, logs, and the SMS analytics API
Providers expose data in three ways:
- Delivery-report webhooks push each status change as it happens.
- Message logs allow lookups of individual messages.
- An SMS analytics API returns aggregated counts over a date range.
Webhooks carry the most detail, so they should feed the primary data store. The SMS analytics API is useful for reconciliation, such as checking our totals against the provider's each day. Logs serve support investigations.
Build one event record per message
Each message should produce a single record that collects every event in its life:
- submission time
- provider acceptance
- operator and route
- delivery receipt and error code
- segment count and cost
- click, reply, and conversion events
The provider message ID and our own reference ID join these events together. Without that join, clicks and conversions can't be attributed to specific messages, and SMS conversion tracking becomes guesswork.
Plan for provider retention limits
Provider dashboards often keep data only briefly. MSG91's documentation, for example, limits log retrieval to 3 days and analytics queries to the last 31 days. Year-on-year trends, audits, and dispute resolution all need longer history. Streaming delivery reports into our own warehouse solves this, and the storage cost is small compared with the analysis it enables.
Operational SMS analytics that catch problems early
Operational SMS analytics answer one question fast: is something breaking right now, and where?
Break everything down by operator and route
A blended delivery rate can look healthy while one operator fails badly. Every core metric should split by destination operator, route, sender, and message type. Latency needs percentiles, not averages. A p50 of three seconds can sit alongside a p95 of ninety seconds, and the slow tail is where users give up.
Watch the gap between delivery and completion
Delivery receipts report what the network says happened. Completion metrics report what users actually did, such as entering an OTP or clicking a link. When delivery stays high but completion drops on one route, the receipts may be unreliable. Some low-quality routes return "delivered" too early. Seeded tests on real handsets confirm the problem before it shows up in revenue.
Track failures by class, including DLT rejections
Group error codes into classes: permanent (invalid or inactive numbers), temporary (congestion, handset off), and compliance (blocked content, opted-out users). Each class needs a different response.
In India, DLT rejections deserve their own line. A spike usually means a template changed or a variable exceeded its registered format. Those failures won't recover through retries, and they signal a template fix rather than a routing problem.
SMS conversion tracking and business outcomes
Operations metrics show whether messages work technically. SMS conversion tracking shows whether they work commercially.
Clicks, replies, and conversions
Tracked short links give click-through rates by campaign, segment, and even operator. Replies measure engagement for two-way flows. Conversions close the loop: an order placed, a payment completed, or a booking confirmed. A URL shortener for SMS handles link tracking while keeping messages within one segment.
Attribution windows need care. A purchase three days after a promotional text may or may not be caused by it. We recommend a fixed window per message type, applied consistently, and holdout groups for campaigns where the budget justifies proving the lift.
OTP completion as a product KPI
For verification flows, the most useful metric is completion rate: verified codes divided by codes sent. It reflects delivery, latency, and user experience in one number. A sudden drop can also signal SMS pumping, since bot-triggered codes are never entered. Our OTP verification API reports completion alongside delivery for this reason.
Evaluating a provider's analytics
When comparing providers, ask five questions:
- Does the API return per-message status, error codes, operator, and cost?
- Are delivery reports pushed by webhook in real time?
- How long are logs and analytics retained, and can data be exported in bulk?
- Can metrics be split by operator, route, and message type?
- Will the provider support seeded handset tests to verify delivery claims?
Clear answers to all five signal analytics that can be trusted. Vague answers usually mean dashboards built for demos rather than operations.
Governance and cost of analytics data
Analytics data contains phone numbers, message content, and behavioral signals. Store numbers masked or hashed wherever the full value isn't required, and restrict raw access by role. India's DPDP Act brings core obligations from 13 May 2027, including purpose limits and retention controls. Set retention by use: detailed records for operations and audits, aggregated data for long-term trends.
Costs come from webhook ingestion, warehouse storage, dashboards, and the engineering time to maintain joins between message IDs and business systems. Legacy CRMs and ERPs often store outcomes without message references, so adding a reference field early saves costly rework later. For teams running WhatsApp alongside SMS, our guide to WhatsApp Business API analytics covers the equivalent metrics on that channel.
Conclusion
Strong SMS API analytics rest on four habits: fixed metric definitions, message-level data in our own warehouse, breakdowns by operator and route, and outcomes joined to every message. Drop "open rate" for plain SMS, and measure clicks, replies, and conversions instead. Watch the gap between delivery and completion, since it often reveals problems first. Helo.ai's SMS API provides real-time delivery reports and message-level data to support this approach.
Frequently asked questions
Can businesses track SMS open rates?
No. Standard business SMS has no read receipt, so opens can't be measured. Businesses measure delivery, link clicks, replies, and conversions instead. WhatsApp and RCS support read receipts when that signal matters.
What is a good SMS delivery rate?
Many providers cite 90% or higher as a realistic target, with results varying by country, operator, and list quality. Compare delivery rates by operator and route, and confirm them against completion or click data.
How long do SMS providers keep analytics data?
It varies widely. Some keep message logs for only a few days and analytics for about a month. Streaming delivery reports into an internal warehouse preserves full history for trends and audits.
How to measure OTP conversion rate?
Divide successfully verified codes by codes sent over the same period. Track it by operator and channel. A sudden drop can signal delivery delays, unreliable routes, or bot-driven SMS pumping.
What is the difference between SMS delivery reports and SMS analytics?
Delivery reports are individual status updates for each message. Analytics aggregate those reports, along with clicks, replies, costs, and conversions, into metrics that show performance across campaigns, routes, and time.


.jpeg&w=96&q=75)